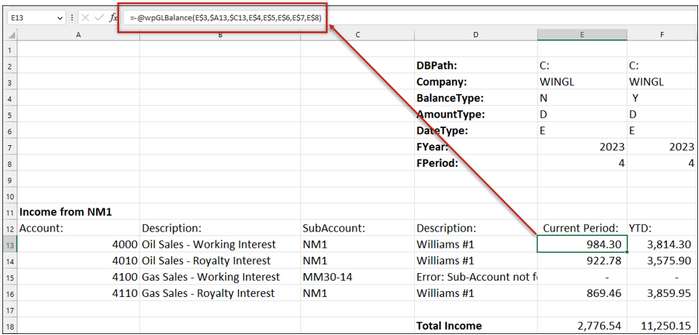
Before digging into the Functions, let's look at what some Excel symbols represent.
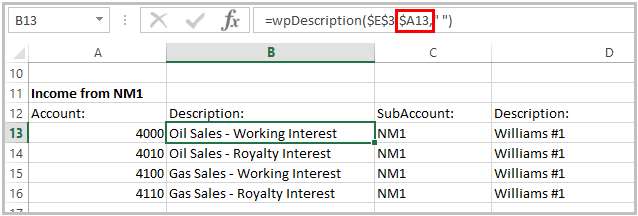
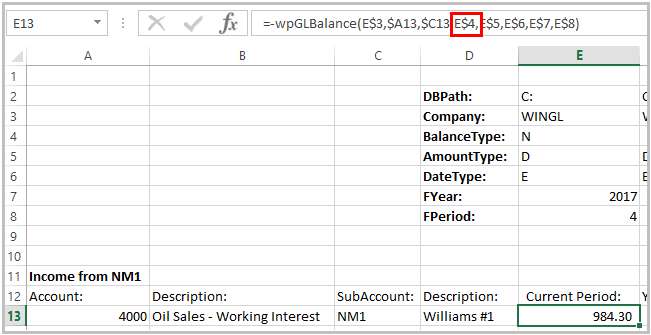
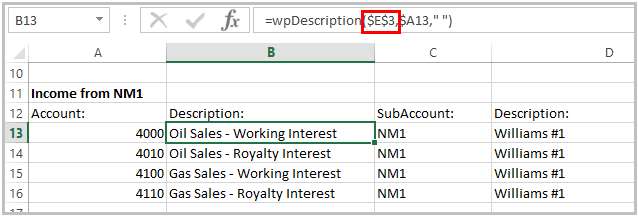
Looking in the function box above, you will see there are all kinds of symbols. •Pak Accounting is using functions that work with our 3rd party DLL to pull live data from the database. When using the functions, start with an “=” following by the function “name” i.e. wpDescription is the function call that we utilize to pull in account and Sub-Account descriptions. Each function will then have calls in “( )” that ensure the correct information is being pulled in. Each Function and Call will be explained in detail later in the document. •$ signs in formulas help expedite copying a report definitions without having to constantly change items. The templates provided for the class and to our customers who have Analytics have 3 different uses of the $ signs. 1.If a report is being built to have Account numbers in column A, but references to multiple periods or time or companies in subsequent columns a $ before the “A” will allow the formula to be drug down the column and across to other columns without losing the “look” to the “A” column.
2.If a report is being built to look at the same row, but different columns, the $ sign will need to be between the column letter and the row number.
3.When the report needs to pull the function from the same cell regardless of the location on the report $ signs before the Column Letter and Row Number will prevent the function call from changing.
Helpful Tip: Using your F4 key while on the cell will add the $ for you. Keep hitting F4 till you get it set the way you wish. For example: if you select D1 and then hit F4, it will change to $D$1. Hit it again; it’ll change to D$1. One more time will change it to $D1. Hitting it one last time will bring it back to D1. This can save you an incredible amount of time when entering several calls.
There are several other Excel tips and tricks that may be referenced later; however, ensuring that the use of $ signs is understood is critical to reading the functions that already exist in the templates.
Setting ranges, multiple options, and financial groups
|
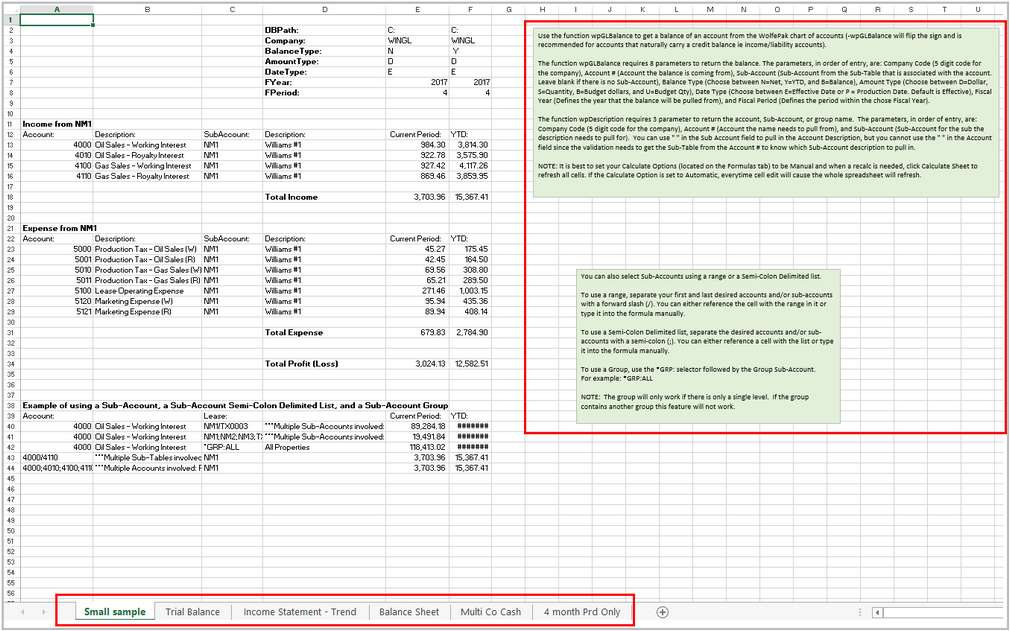
When opening the Small Sample tab of the wpAnalyticsTemplate, notice the information in the green boxes. These are tips and tricks to help your file work correctly. Also, notice that you can keep multiple tabs for different reports all in the same workbook.
Reference Guide for Pak Accounting Analytics can be printed with detailed information and examples on all available functions.
When baking a cake, you start with a recipe. You have a set of ingredients that must be mixed in a certain order for the best results. Functions are much like that – you have a set of criteria that must be followed in a certain order so that you can get the desired outcome. Different functions (recipes) will result in different outcomes (types of desserts). Let’s look at some basic information and learn about our ingredients.
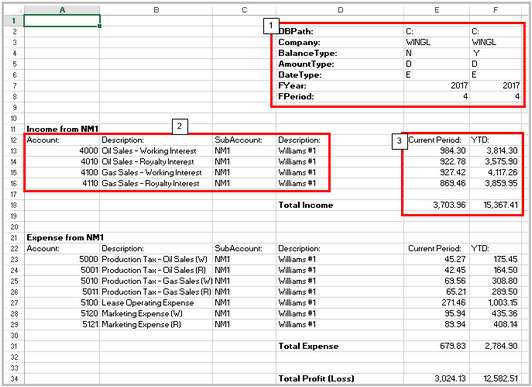
1.This section holds the most information for our formula. It tells the worksheet where to look for company information and the type of information we want. Add a column for each group of information you would like to see. For example, Column E is set to N for Net information, while Column F is set to Y for YTD information.
2.Account/Sub-Account and Description a.Enter in the Account Number / Sub-Account (if applicable) to be pulled in. See the Excel Functions section to make dragging/copying easier. b.The Description field is also called the wpDescription function. We will discuss this in more detail shortly. 3.The Amount columns are also called wpGLBalance function. In the example below, these columns are Current Period and YTD. We will discuss this in more detail shortly. Clicking into one of the fields, you can see the fields in the formula box:
|
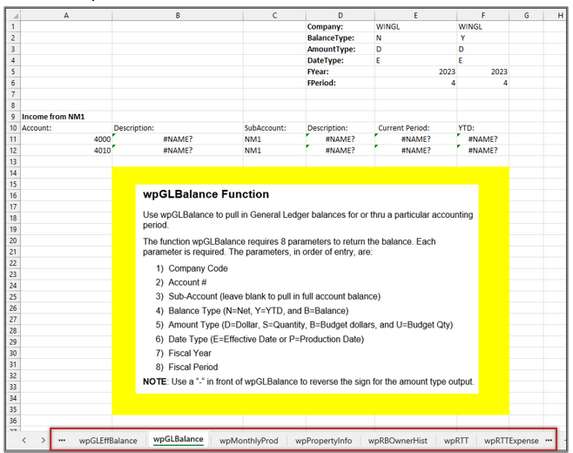
Use the function wpGLBalance to get a balance of an account from the Pak Accounting chart of accounts 2.Account # 3.Sub-Account There are multiple ways to write the function, so we are going to cover a couple different options. If the report is being written in a manner that would allow the parameters to be changed easily, then the definition will have column/row calls for each of the parameters.
NOTE: none of these have referenced the DBPath. This is only required when the WP Data and WP Program are not located on the same server/drive. If you need the DBPath, all functions have ex added to the end of them and the functions first call becomes the DBPath followed by the remaining calls. i.e. =wpGLBalanceex(E$2,E$3,$A14,$C13,E$4,E$5,E$6,E$7,E$8) |
Use wpDescription to pull the Account description from the Chart of Accounts or the Sub-Account description from Sub-Account Maintenance. The function wpDescription requires 3 parameters to return the Account, Sub-Account, or Group name. The parameters, in order of entry, are: 2.Account # 3.Sub-Account
NOTE: To pull the Account description, use “ “ in Sub-Account field. The Account field must be defined to pull in the Sub-Account description, because the table attached to the account is used to determine which description needs to be pulled in.
NOTE: “ “ or “” has to be utilized in the Sub-Account field call location; otherwise, the function will not work.
|
Use wpAFE to pull in AFE information (budget and actual). The function wpAFE requires 9 parameters to return the balance. The parameters, in order of entry, are: 2.Account # 3.Sub-Account 4.AFE number 5.AFE stage
|
The wpGLEffBalance will pull the amount based on the from/thru date defined. The function wpGLEffBalance requires 7 parameters to return the balance. The parameters, in order of entry, are: 2.Account # 3.Sub-Account 6.From Date 7.Thru Date
|
Use this function to pull in balances at the deck level for Revenue and Billing type accounts. The function requires 9 parameters to return the value. The parameters, in order of entry, are: 1.Company Code 2.Account Number (must be Revenue or Billing Type account) 3.Property Number 4.Deck (blank signifies blank deck vs all decks) 5.Balance Type (N = Net, Y = YTD, and B = Balance) 6.Amount Type (E = Effective Date or P = Production Date) 7.Date Type (E = Effective Date or P = Production Date) 8.From Date (MM/DD/YYYY) if left blank will assume beginning of time. 9.Thru Date (MM/DD/YYYY) if left blank will assume end of time.
|
Use this function to pull in Division of Interest details for a specific deck that may be used in conjunction with wpGLDeckBalance for additional analysis. The function requires 11 parameters to return the value. The parameters, in order of entry are: 1.Company Code 2.Property Number 3.Deck (blank signifies blank deck vs all decks) 4.Owner AR account # (will pull in billing deleted interest account or other non-AR account that could be attributed to the DOI Deck) 5.Owner Number (In most cases this will be the Owner Number, but it could be Property Number) 6.Interest Type (Typically W=Working, R=Royalty, O=Override, C=Carried, and P=Production Payment, but could also contain a number if there are multiple interest for the same owner for the same interest type on a specific DOI Deck) if left blank the owner must only appear on the deck once in order to pull the correct decimal interest 7.Suspense Code (Pay or Legal – if L with no additional distinction is used all legal suspense will pull) 8.Account # (Revenue or Billing Account Number) 9.Value (S=Suspense Code, B=Billing Decimal Interest, R=Revenue Decimal Interest, or D=Deleted Interest (display Y/N for the account defined)) * 10.Effective Date (MM/YYYY) if left blank will assume end of time 11.Include Option (D=Deleted Interest)
|
