Also see: Financial Reporting Overview for more information on tabs and menu items at the bottom of the screen.
How do I set up a Spreadsheet?
Spreadsheet reporting is a great management tool that highlights key operating numbers and statistics enabling users to spot problems. The one line per cost center, per well is an easy format to review and act upon. Spreadsheet reporting can be generated at a company level, a group level, or both providing timely and complete information for desired properties.
Financial information in Pak Accounting can be summarized into a spreadsheet format and printed through basic financial reporting procedures. To start you need to set up report definitions to define the rows and columns of the spreadsheet.
NOTES:
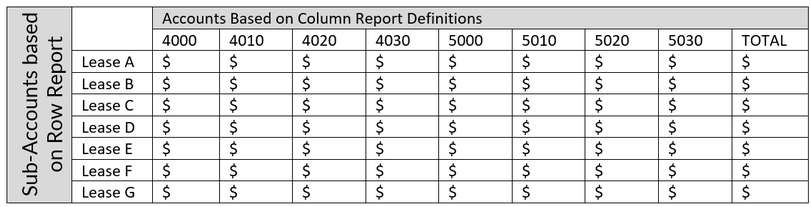
•Two reports will need to be defined: A Report for Rows and a Report for Columns.
•When defining a spreadsheet report, both the row and the column definitions must be considered in the account ranges.
For example, management wants to create an Internal Property Operating Statement for Texas properties. The report will need to show the properties as rows. The columns will consist of quantities, revenue, and expenses to arrive at Net Revenue. Management would like the report to resemble the one below
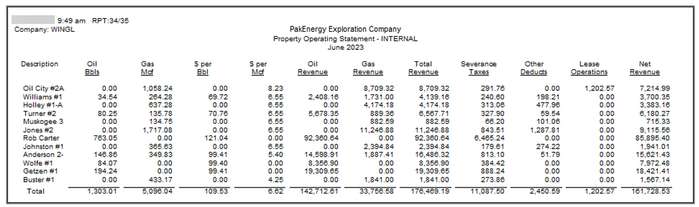
To accomplish this, two reports will be defined and used—a report for rows and a report for columns. When defining a spreadsheet report, both the row and the column definitions must be considered in the account ranges.
The first step is to create a report outline defining the needed rows and columns. Rows going down the page can be grouped and subtotaled by whatever makes sense to you. Do you want to view the report by Lease #? By State and County? Grouped by Operator? The list is endless…
Columns can be added for whatever you determine is necessary. Do you want to see Oil and Gas Volume, Revenue, Expenses, and Net? What are the key essential elements necessary to provide the information management wants?
The Row Report is the simplest to define since the bulk of the detail will be set up in the Column Report or defined on the Report screen. Below is the most common setup. The report can be as complex as you need it to be; however, with the power of Financial Groups (which we will learn about in the next section), there is little need to make this complex.
Set up a Row Report as an "S" record to print a line for every Sub-Account in the defined account range. Make sure the range of accounts includes any accounts that will be reported in columns. This is an internal report in our example, so we will only include the P&L range of 4000 – 5999. If you need a report for the 100% numbers, you will set the range for 9000 – 9999. Adding multiple ranges for the “S” record will run the risk of seeing the Sub-Account twice on the report.
Since the Spreadsheet reports are run in pairs, it’s good practice to name both reports the same but differentiate them by beginning them with “SS Row” or “SS Column.”
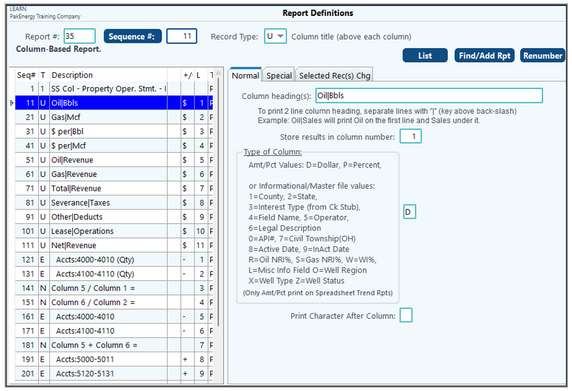
Column Based Report
When defining the Row Based Report definitions, we used various Record Types (H, A, P, T, etc.) to describe how we wanted the report to look going down the page. To define each column, we also use different record types to define the different elements and/or data sources. To accomplish this, we use the following Column Based Record types:
U - Defines the title that will print for the column.
E – Defines one or more account ranges to be accumulated for the column.
N – Defines one or more math/formula for a column.
For each column, you will have a “U” record for the column to print. Then depending on the contents of the column, you could have one or more E or N records (either/or not mixed).
NOTES:
•When doing advanced math functions, there are times that you may want the system to look at an account but not print on the report. In that case, you would set up your E or N record but not associate it with a U record.
•There is a Wildcard feature included on the screen that allows for the restriction of Sub-Accounts. For example, "*TX" can be entered into the Wildcard field. All Sub-Accounts containing "TX" will be included. However, this feature will work only in a report where the column represents one or more different Sub-Accounts and the accounts are set to be listed as rows. See Record Type "E" for more information.
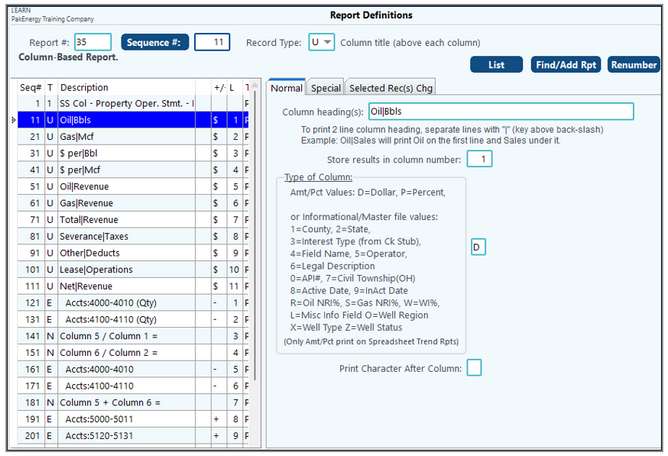
Tip: To use these codes in a spreadsheet report, enter a “U” record with the desired code (For example, a “U” record with code “1” for the county). The report must have a minimum of one column that pulls in financial information (For example, a “U” record with a “D” or “P” code that has a corresponding “E” Record).
|
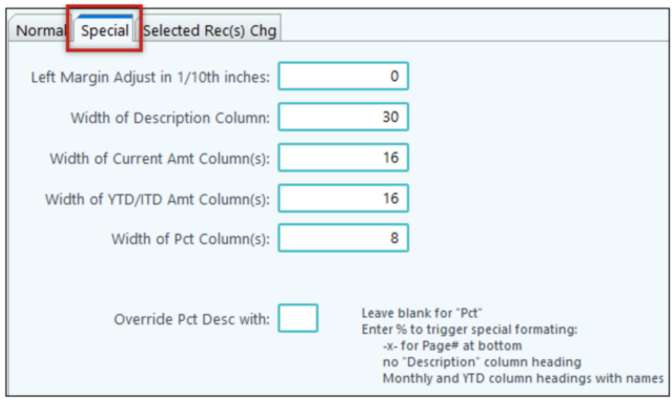
Sequence #1. On this sequence, the Special tab allows you to set your column widths.
Spreadsheet Report with Months in columns. A spreadsheet report has a special setup where each month is in a separate column. These settings are entered on the “U” records on the “Special” tab in the “Subtract # Time Periods being included in report” field. For January, enter an “11.” For February, use “10.” For March, use “9” and so forth for the remaining months, decreasing the number by 1 for each subsequent month. December will have a zero. On the report screen, the Current Period Column From and Thru dates must be the last month of that year – 12/2022 thru 12/2022. |
This tab provides the ability to delete selected sequences, move column numbers up or down, move selected records up or down, change Sub-Account restrictions, or change the accumulate by sign on selected records. |
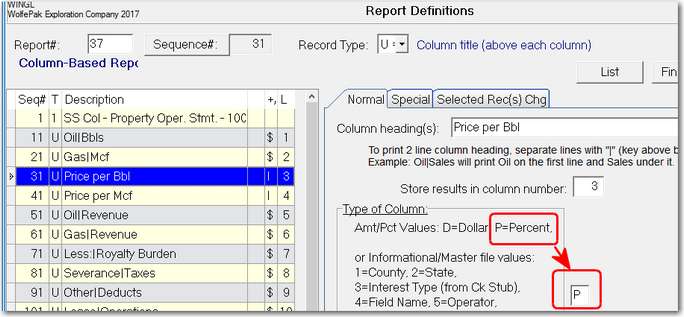
How to do math calculations like “price per…” or “cost per…” in a spreadsheet report when the record type “O” is set to no decimals for dollars in the row definition report of the spreadsheet report. On the “U” sequence for the column, enter a “P” for percent instead of the default “D” for dollars
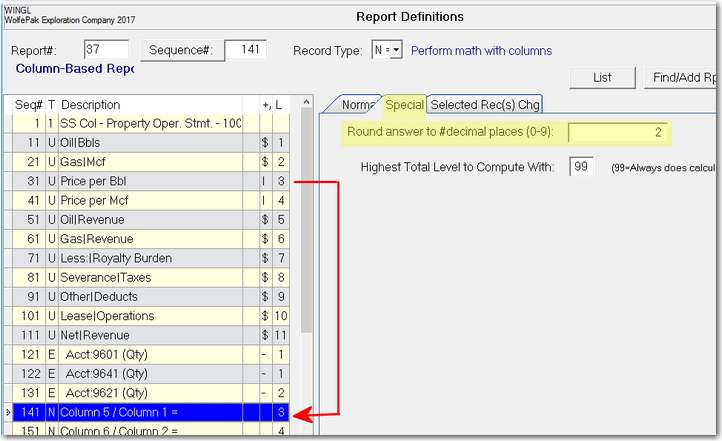
You can set the number of decimals to print on the report on the special tab for the “N” record type sequence for this math column
|
Note: When you setup the report definitions for spreadsheets, the column widths will auto adjust to fit your information unless you use the following widths: 10 for the description, 5 for the current Period/YTD amount columns and 3 for the Pct columns.
Also see: