The Drill Down option in Financial Reporting allows you to quickly verify specific transactions that make up a line item on any generated report. Instead of printing a report to paper or viewing it as if on a piece of paper on the screen, the “drill” down option allows a more interactive view of the data. Not only do you get a reproduction of the printed report loaded into grid, but each cell of the grid can also be double-clicked to see the underlying coding elements that make up that line items, and with another double click, be able to drill down into individual transactions. Drilling a little deeper (another double click) reveals the other side of the entry (the entire journal entry).
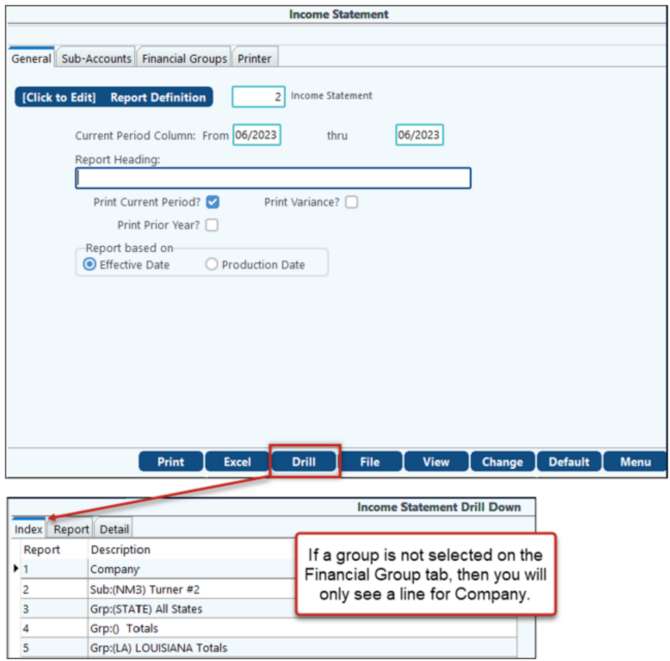
Instead of viewing the report, select the Drill option. PakEnergy provides an Index tab that contains a line for each report that you run. The Report tab allows you to view the report in grid format and drill down to the detail level on the Detail tab. The Detail tab provides the transactions that make up a specific amount for a line item on the report. Drilling down from this tab takes you to the View/Trend screen for that Account/Sub-Account combination.
Double click on the report or choose the Report tab. You can then drill-down on a specific line item to see the detail or click on the Detail tab. When scrolling from right to left, the left columns will be frozen (Acct, Sub#, Acct Desc, Sub# Desc, Description) for easier viewing of the data and so that the Account/Sub-Account information is always visible.
Which column we double-click in determines the date range the View/Trend by Account displays.
Below is an example of “drilling” down on an amount to research it.
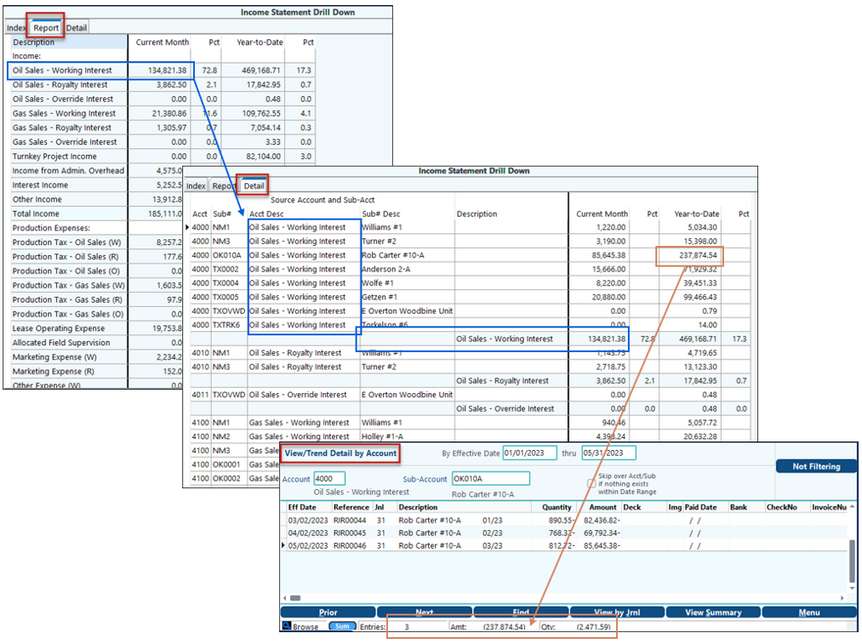
NOTE: You can return to the financial report itself by selecting the “Report” tab. From the View Trend Detail by Account, the options are endless. You can double-click to see the journal entries. You can right-click and change account numbers. You can change the effective date, etc. Everything you can do from the normal F4 View/Trend is available! You can return to the financial report itself by clicking on the “Report” tab at the top of the screen.
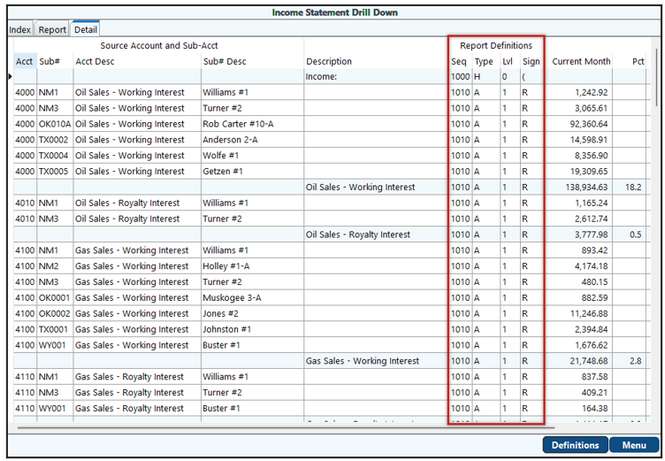
While on the Detail grid, click on the Definitions button. This will add 4 new columns to the middle of the grid that describe the “Report Definitions” options that created this report. Double-clicking into the Seq, Type, Lvl, or Sign field for an account will take you to the report definitions for that particular definition. Changes can be made if needed. Clicking on the “Definitions” button again will remove the columns like a toggle on/off.
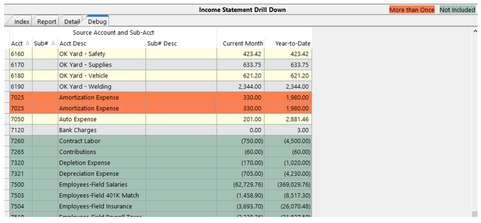
From the Detail tab of the financial statement, Click on the “Debug” button and a new Tab will appear called the “Debug” grid.
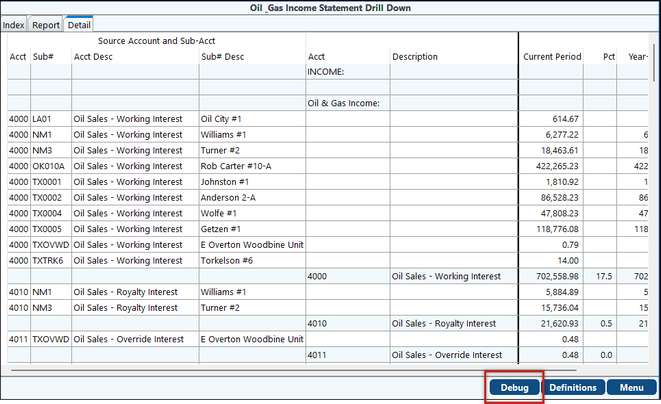
It takes all the Acct/sub lines that are in the “Detail” grid and sorts them by Account/Sub. It also takes a look at all the Account/Subs and if there are some that have dollar amounts that weren’t included, it lists those in green.
If your report definition included an Account/Sub combination more than once, it will show up on the “Debug” grid more than once. The ones that are listed more than once will be displayed in orange. Including an account/sub more than once usually indicates an error.
Toggle the Report Definition columns to display and discover which report definition detail caused the account/sub to be included for each line. Double click on one of the four report definition columns in order to edit or review the report definitions.