Overview
There is a new Sales Reporting sub-tab in Property Maintenance that captures information needed to summarize the Sales revenue from Run Ticket information. This included Sales Contract Number and Price Base Code. This information then feeds into the EOM-1 Economics Analysis - Economics by Destination Detail report.
Setup
There is no setup to turn on this feature. However, there is setup to be done in Property Maintenance.
Property > Price Contract > Sales Reporting tab #
Fill in the Product, Effective Date, Sales Contract Number, Price Base Code, and Station.
Using the green “+” and red “- “, lines can be added or removed. More than one station can be set per property.

There is also a Sales Reporting option on the Property Import feature. Using this feature found in Property > Utility > Import from Excel, you can easily update your Properties.

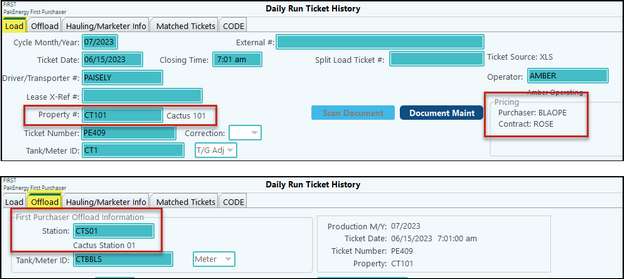
The Sales information will be captured when Run Tickets are entered for a specific Property/Lease/Station and the corresponding Station is used on the Offload tab.
Report: EOM-1 Economics Analysis
This report will bring in information from Run Tickets, Sales Reporting, and also Costs & Tariff rate information (if applicable) for a more complete financial overview. This allows you to better see your margin.
Cost of sales (offloads) captured from the run tickets will summarize all tickets from the destination location from the Offload tab and Sales Contract information.
Cycle Month/Year or Ticket Effective Dates
|
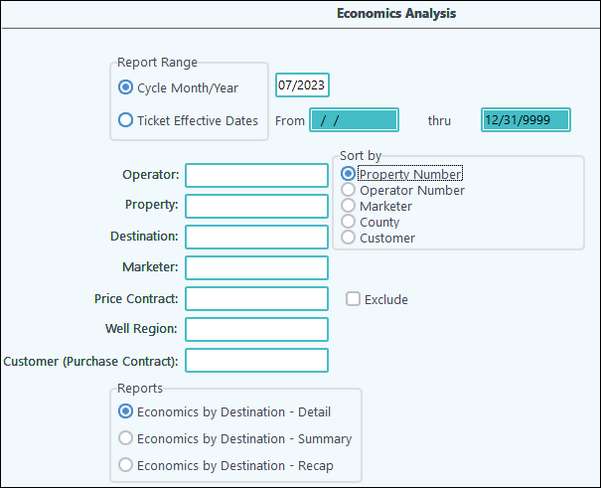
This report allows you to filter your results by either Cycle Month/Year -OR- Ticket Effective Dates.
|
Operator
|
Filter report down to a single Operator
|
Property
|
Filter report down to a single Property
|
Destination
|
Filter report down to a single Destination (Offload Station)
|
Marketer
|
This field will include employees with type "Marketer" from Payroll - Employee Maintenance.
|
Price Contract (Exclude)
|
This field and corresponding Exclude check box allows you to either filter by or exclude a specific Price Contract. This populates from the Other Transportation cost table (ability to include a contract)
|
Well Region
|
This is based on the Well Region set on a property. However, the information itself pulls from Internal Trucking Costs.
|
Customer (Purchase Contract)
|
This will be an Operator record.
|
Sort By (Property #, Operator #, Marketer, County, Customer)
|
Select how the report will be sorted when printed/viewed/exported.
|
Reports (Detail, Summary, Recap)
|
Detail – Property detail will include purchase, sale, and cost breakouts.
Summary – one line per property
Recap – this report will show more detailed information via columns instead of rows.
|
NOTES:
•Split Loads will appear together in the destination
•Gatherer information will be segregated when a property is hauled by both a third party and an internal driver. This way margins are reported accurately.
oExternal Truck fee will populate/group from the tickets. If the rest of the criteria have NO match, then NO fee will display,
oIf Driver # is blank on the ticket, then the Gatherer will also be blank.
•The Economics reports will correctly handle volumes and prices when contracts change on a property.
For example: When choosing cycle date range for a given property and one contract expires in January and a new contract takes over in February
•The report excludes a few types of tickets
oSales tickets (Product OSC on the Price Contract)
oRejected tickets
oAllocated tickets (Only pull Commingled and Normal)
oRecords in Daily Tank Gauge
Detail Report
Destination Name including Property # with Destination Name
|
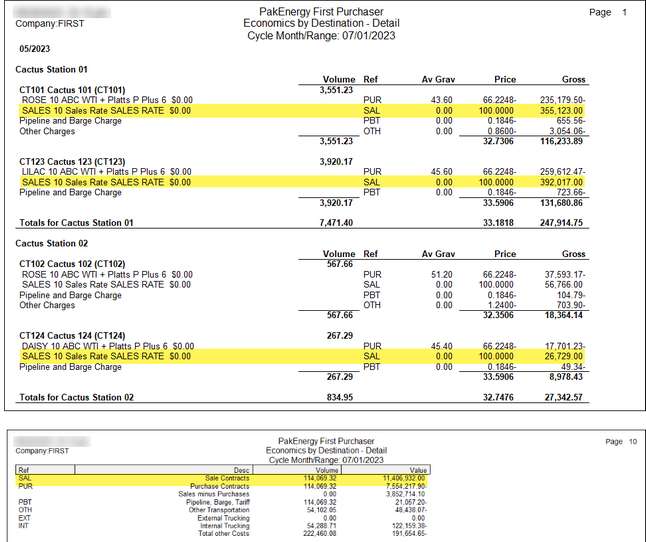
Volumes for all tickets for a destination location at the lease will be summarized. This information pulls from the Run Ticket Grid View. There is one line per contract. This will included Destination Name, Lease number, Lease name, and Description text (Sales Contract information including Contract Number, Contract name, Price Base Code, Price Index Code, Product)
|
Volume
|
This pulls from the Run Ticket Grid View for corresponding contracts for that destination. Volume is only recorded at the lease level.
|
Ref
|
Indicates the detail line item:
•PUR - Purchase Contract costs
•SAL - Sales Contract revenue
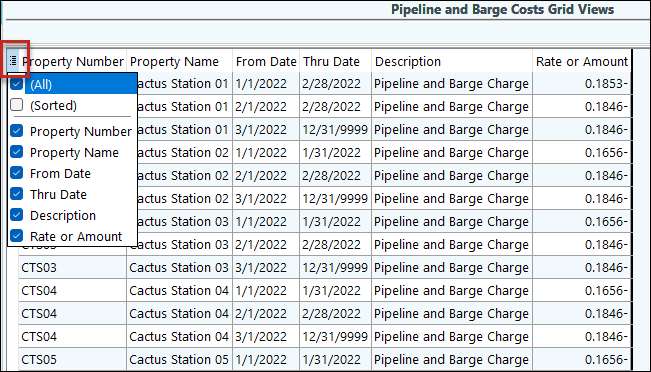
•PBT - Pipeline Barge and Tariffs Cost Table
•OTH - Other Transportation Cost Table
•EXT - External Trucking Cost Table
•INT - Internal Trucking Cost Table |
Avg Grav
|
•This is an average (not a sum) for all the Sales tickets for the contract.
•Based on the percent of the station's volume for the indicated period.
•These are based on tickets where the pickup lease is the station and will be the same number for all leases in that station.
•The average gravity is coming from the contract volume table. The system accumulates the volume times the gravity on each contract volume record then divides this total by the volume on each record. This example is computed as follows:
o(volume) 34,594.31 * (gravity) 21.5 = (total volume) 743,777.665
o(total volume) 743,777.665 / (volume) 34,594.31 = (average gravity) 21.5 |
Price
|
•This is a weighted average (not a sum) price based on contract volumes for the Run Tickets for the effective date range.
•For each ticket, the price is based on that ticket's lease's Sales Contract plus Price Base Code. The report will show the weighted price divided by the total volume for the lease. |
Gross
|
This field calculates the Volume (adjusted for average gravity) times Price. This should be a positive number as this is revenue.
|
Totals
|
Each section (depending on Sort By option) will have a total line. Also, the last page of the report will have totals for each Ref Type.
|
Summary Report
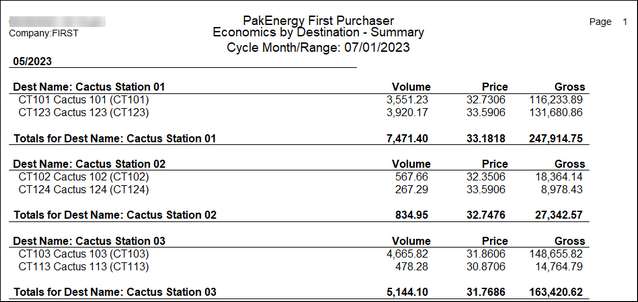
Example of the Sort By being Property Number. In this case the Header Record will be the Destination Name.
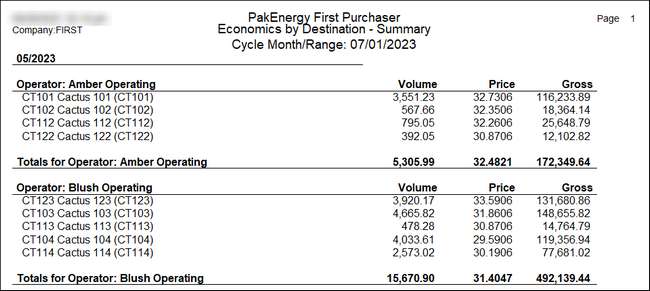
Example of the Sort By being Operator Number. In this case the Header Record will be the Operator Name.
Header Record
|
The header record will be determined by the Sort By option selected. Each line under the header line contains the Lease number and Lease name. Volumes for all tickets for a destination at the lease will be summarized.
|
Volume
|
This is the summary of all volumes for the lease
|
Price
|
•This is a weighted average (not a sum) price based on contract volumes for the Run Tickets for the effective date range.
•For each ticket, the price is based on that ticket's lease's Sales Contract plus Price Base Code. The report will show the weighted price divided by the total volume for the lease. |
Gross
|
This field calculates the Volume (adjusted for average gravity) times Price. This should be a positive number as this is revenue.
|
Totals for…
|
Each section (depending on Sort By option) will have a total line.
|
Grand Total
|
The Grand Total will include all previous section totals.
|
Recap Report
Pulled from the Detail Report, this is a summary of all the tickets for each lease/destination combination

MKTR - Marketer
|
This field will include employees with type "Marketer" (from Payroll - Employee Maintenance) on the Run Ticket for the Lease at the Destination location.
|
Customer
|
Run Statement Operator name
|
Gatherer
|
•Internal Trucking - Purchaser on purchase contract
•External Trucking - External Truck Cost table should populate Transporter from header, |
Lease number
|
Lease Number from Property Maintenance
|
Lease name
|
Lease Name from Property Maintenance
|
Destination Location
|
Destination Location corresponding on the Run Ticket for the Lease.
|
Miles
|
For certain Recap Report Ref cost types - otherwise its blank
|
Volume
|
This is the summary of all volumes for the lease
|
Gravity
|
•This is an average (not a sum) for all the Sales tickets for the contract.
•Based on the percent of the station's volume for the indicated period.
•These are based on tickets where the pickup lease is the station and will be the same number for all leases in that station.
•The average gravity is coming from the contract volume table. The system accumulates the volume times the gravity on each contract volume record then divides this total by the volume on each record. This example is computed as follows:
o(volume) 34,594.31 * (gravity) 21.5 = (total volume) 743,777.665
o(total volume) 743,777.665 / (volume) 34,594.31 = (average gravity) 21.5 |
Purchaser contract number
|
Pulled from the purchaser’s Property Maintenance – Price Contract tab.
|
Purchaser posting prem
|
Average for the contract number
|
Purchaser price
|
Average Purchase Price
|
PBT
|
Average Pipeline Barge Tariff rate
|
OTH
|
Average Other Transportation rate
|
INT
|
Average Internal Trucking rate.
|
EXT
|
Average External Trucking rate.
|
Total Costs
|
sum of PBT + OTH + INT + EXT
|
Sales contract number
|
Pulled from the purchaser’s Property Maintenance – Price Contract tab – Sales Reporting sub-tab.
|
Sales posting premium
|
Average Price Adjustment.
|
Price
|
Average Sales Price.
|
Margin
|
Sales – Purchases – Total Costs for the lease/destination location. This is a summary of fields in the Recap Ref columns. All of the detail lines are a price/bbl.
|
Profit (Loss)
|
Margin times Volume
|
|
