Also see: Financial Reporting Overview for more information on tabs and menu items at the bottom of the screen.
A Balance Sheet is an itemized statement that lists the total assets and the total liabilities of a given business to portray its net worth at a given moment of time. The amounts shown on a Balance Sheet are generally the historic cost of items and not their current values. Also known as a STATEMENT OF FINANCIAL CONDITION.
A Balance Sheet can be printed by selecting the option from the Financial Reporting Menu. The Production date option is available with the Dual Date feature.
NOTE: When running a report with Asset/Liability accounts, in order to print balances instead of net activity an "O" record should be added at the beginning of the report with the "Curr Amts" field on the Special tab set to "B."
Balance Sheet - General Tab |
|
Report Selection Field |
Choose the report desired to run the balance sheet |
[Click to Edit] Report Definition |
This button will lead to the report definitions for the report chosen for viewing or editing. |
Report Type |
Select how you want the Balance sheet to print. |
Print Variance? |
Check to print the variance |
Current Year/Balance Forward |
Enter in the dates for the report. |
Report Heading |
An additional description can be added in this field that will print underneath the date in the report heading. |
Report based on: |
Effective date (G/L date) or Production date. Production Date will only be available with the Dual Date reporting optional add-on. |
NOTE: If using the option "Any 2 Dates", Date 1 must be a later date than Date 2.
NOTE: If using the 2 column option, there is a special technique to add an underline in the second column. See Balance Sheet 2 column for more information.
This tab allows you to run the desired report by a range of Sub-Accounts or selected Sub-Accounts either with or without a financial group. Check the box at the top of the screen if you want a statement for the entire company as well as the Sub-Accounts and/or group selected. To select specific Sub-Accounts to run the report for, click on, or multi-select the desired Sub-Accounts from the "List of All Items" on the left-hand side of the screen. Use the red arrows to move a single Sub-Account from the "List of All Items" to the "List of Selected Items" or vice verse. Use the blue arrows to move multiple Sub-Accounts from the "List of All Items" to the "List of Selected Items" or vice verse.
|
||||||||||||||
The Financial Groups tab allows for the Balance Sheet Report to be run by pre-defined financial groups instead of Sub-Accounts. Choose the desired financial group in the "Print Report(s) for Group#" field. The Group levels define whether the trend report will be created for all tiers of the financial group or only a part of the tiers. Next, make a selection to have Pak Accounting check inactive dates on Sub-Accounts before printing. Choose to have everyone checked, Active only, Inactive only, or Closed this period. Finally, check the box "Limit which Sub-Account(s) to be included in Group, based on dollar comparison" if desired. If this selection is made, additional options will appear.
NOTE: If you want to compare wells that had lost money in one year, 2022 for example, with 2023 to see if they were now making money, you would enter 12/2022 in the"Last Month/Year to Compare" field. The date on the General tab would be 12/2023. The system will then compare the two years to decide what to print. Additionally, when selecting criteria for an amount (Sum is Greater Than, Sum is Less Than, Sum is not equal), the following must be remembered: Income has a credit balance. To see if the wells in the previous example made money, select "Sum is less than" and enter an amount in the amount field. Expenses have a debit balance. To view the expenses select 'Sum is Greater than" and enter an amount in the amount field.
|
||||||||||||
The Printer tab allows for print options to be selected.
|
||||||||||||||||||||
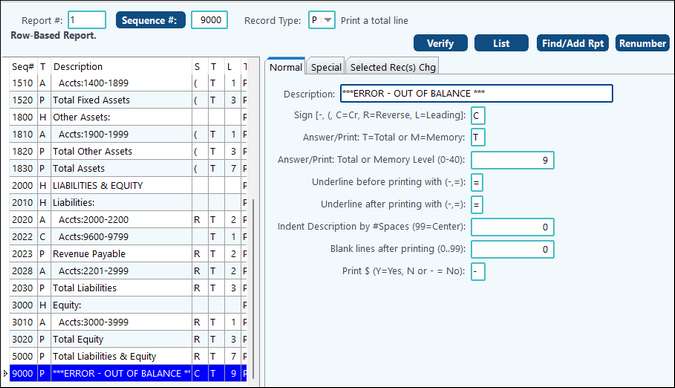
An easy addition to the report definition is to add a line to do the math between Total Assets and Total Liabilities & Equity. Add a line to your current report definition:
Then if your report is out of balance, a line will be added at the bottom of your report.
|
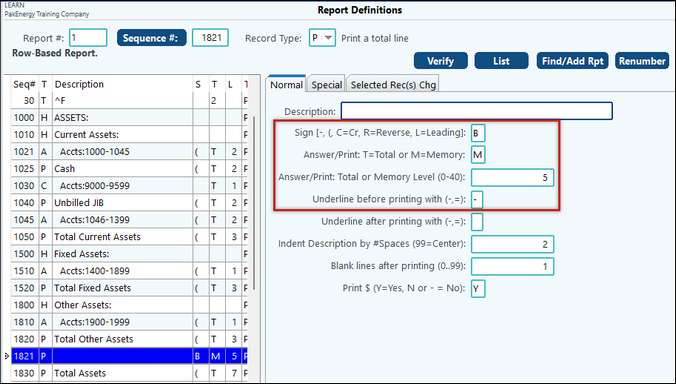
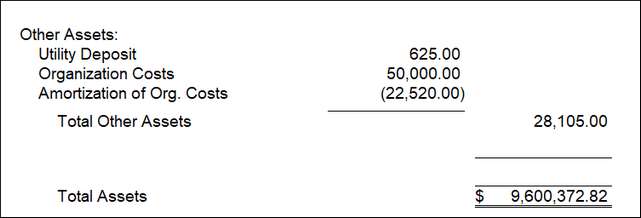
This feature is specific to placing an underline in the second column when printing 2 columns Balance Sheets: The report definition total/memory levels determine which column to print the amount and underline.
In report definitions for the report:
a)Do not enter a description b)For the sign field, enter a "B", this is a special code that suppresses printing the zeros (i.e. 0.00) on the report. c)Use a Memory Level ("M") 5+ for a single underline or 2+ for a double underline. d)Make sure you enter an underline "-" or "=", before or after depending on where you want it to print.
Example:
|


